 Air Quality in San Miguel de Allende, Mexico
Live IAQ Monitor, Particle Counts, Particle Types AQI: PM 2.5,
PM 10
- POST a QUESTION or COMMENT about airborne dust contents, mold, pollen, allergens in Central Mexico
Air quality & airborne dust particle analysis for San Miguel de Allende, Mexico:
InspectAPedia tolerates no conflicts of interest. We have no relationship with advertisers, products, or services discussed at this website.
- Daniel Friedman, Publisher/Editor/Author - See WHO ARE WE?
What is in the Air in San Miguel de Allende?
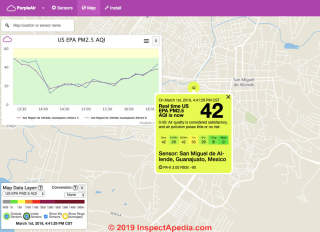
Above: current PM2.5 Air Quality Index for San Miguel de Allende, Guanajuato, Mexico, measured at a representative indoor location, ventilated with outdoor air, in Col. San Antonio. We vary these IAQ reports between outdoor sampling and sampling of a representative indoor environment in the same city.
This article describes an ongoing series of air quality studies that report on the nature of outdoor airborne particulates in San Miguel de Allende, located in Guanajuato, Mexico.
San Miguel de Allende is a colonial city of 140,000 located at about 6500 feet of altitude in the center of Mexico, about 274 kilometers north of Mexico City. Here we report on the results of air quality tests based on particle samples collected at different seasons and time of day and under varying weather conditions.
 Daniel Friedman, AIHA, & Isabel Sanchez Luna, Amb. Eng.
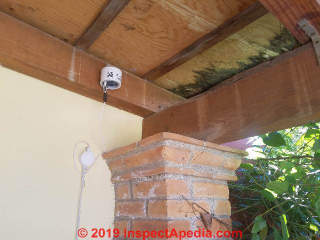
Shown in our photo: a PurpleAir airborne particle monitor installed in San Miguel de Allende, at an altitude above sea level of about 6200 ft. (1890 m) and at about 30 ft. above street level.
[2023/03/10 update: sensor moved indoors in the same neighborhood]
[Click to enlarge any image]
This is the San Miguel de Allende air quality monitoring device whose live data you see above.
Below we provide a link to a map showing the location of this air quality monitoring device.
This article describes limited independent test results of airborne particle level monitoring results and of actual contents of typical airborne dust sampled both outdoors and inside buildings in San Miguel de Allende,Guanajuato, Mexico.
Airborne Particle Counts: San Miguel de Allende, Guanajuato
March 2019, updated January 2020 PM2.5 PM10 Level study in process.
The particle monitoring device is under a shade-roof but exposed to outdoor air and winds.
Live data giving airborne particle concentrations in San Miguel de Allende
Above on this page we provide live PM2.5 air quality index data for San Miguel de Allende.
On the LIVE / REAL TIME map linked below you can diplay other data such as the PM10 AQI, temperature, humidity, and a graph of air quality measures over various time intervals
- LIVE / REAL TIME PM2.5 LEVELS AQI San Miguel de Allende live airborne particle count by day, week, month as well as in half hour increments as well as temperature and humidity data
You'll need to use your browser's "BACK" button to return to this article.
The data from this continuous airborne particle monitor is shared with national and international reporting networks such as AQICN who produce a world-wide air quality monitoring map whose link we give just below.
On that map if you zoom in on Mexico and then to central Mexico you'll find our San Miguel de Allende monitor data included.
- AQICN the Air Quality Index Project who produce a WORLD WIDE AIR QUALITY MAP, live airborne particle counts website: http://aqicn.org/map/world/
Website excerpt:
The World Air Quality Index project is a non-profit project started in 2007. Its mission is to promote air pollution awareness for citizens and provide a unified and world-wide air quality information.
The project is providing transparent air quality information for more than 100 countries, covering more than 12,000 stations in 1000 major cities, via those two websites: aqicn.org and waqi.info.
The PurpleAir Air Quality Monitor can report both real time and graphs of measurements over time (hour, day, week) of the following parameters.
All of the types of airborne particle level measures given below can be selected by changing the Map Data Layer using the link I give just above.
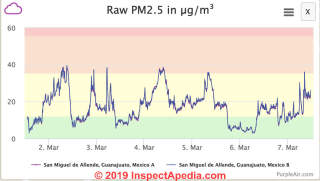
Typical raw PM2.5 in ug /m3 in early March 2019 shownon the graph below for our San Miguel de Allende air sampler ranged from a low of PM2.5=3 to a high of PM2.5=38.
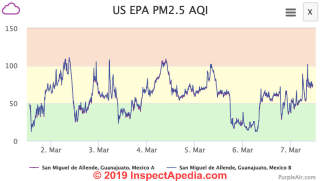
Typical US EPA Standard PM2.5 levels in early March 2019 shown on the graph below ranged from a low of PM2.5=14 to a high PM2.5=99 with an average generally under PM2.5=50
Average US EPA Standard PM2.5 level for the first week in March 2019 was PM2.5=29
Exposure Limits for PM2.5 PM10 and others are given at AIRBORNE PARTICLE SIZE DEFINITIONS & TYPES
- Real Time US EPA PM10 AQI San Miguel de Allende
- Real Time US EPA Village Green Air Quality Index
- Canadian AQHI
- Temperature °F and °C
- Raw PM1.0 in ug/M3
- Raw PM2.5 in ug/M3
- Raw PM10 in ug/M
- Raw 0.3um count /dl, Raw 0.5um count /dl, Raw 1.0um count /dl
- Raw 2.5um count /dl, Raw 5.0um count /dl, Raw 10um count /dl
Air Quality Index or IAQ Index Standards & Definitions
- Exposure Limits for PM2.5 PM10 and others are given at AIRBORNE PARTICLE SIZE DEFINITIONS & TYPES
- OSHA, PERMISSIBLE EXPOSURE LIMITS [PDF], retrieved 2018/07/20, original source: https://www.osha.gov/dte/grant_materials/fy11/sh-22224-11/7_Health_Env_Control.pptx
- PurpleAir PM II IAQ Sampler Details
The PurpleAir (PA-II) Sensor is an optical particle counter. Measurements of PM1.0, PM2.5 & PM10 mass concentrations are calculated from the counts.
Principle of Operation PurpleAir PA-II uses Plantower PMS5003 laser particle counter, where laser beams detect particles going past by their reflectivity. These sensors count suspended particles in sizes of 0.3, 0.5, 1.0, 2.5, 5.0 and 10um.
These particle counts are processed by the sensor using a complex algorithm to calculate the PM1.0, PM2.5 & PM10 mass in ug/m3. PMS5003 sensors come factory calibrated. PurpleAir PA-II uses two identical PMS5003 sensor units attached to each other and placed in the same shelter. - SouthCoast AQMD
...
The PA-II and PA-II-SD sensors contain 2 laser counters that report independently, hence channel A and channel B. This is to detect any "noise" in the data.
Each channel should report within ~10% of each other.
It is possible for debris or an insect to get inside the laser counters causing the channels to report differently from each other.
If this does occur you can remedy it by a shop vac or vacuum and placing it on the bottom of the sensor for 2-3 minutes. If this does not remedy the issue, you can try clearing out the laser counter with compressed air.PurpleAir sensors were tested by the South Coast AQMD and in their laboratory study did not find a link with sensor performance and temperature and humidity. - Mallory at PurpleAir, personal correspondence, 2019/03/07
SouthCoast AQMD Air Quality Sensor Performance Evaluation Center Contact: PurpleAir PA-II SCAQMD / Attn: AQ-SPEC 21865 Copley Drive Diamond Bar, CA 91765-4178 USA AQ-SPEC Hotline: +1 (909) 396-2713 e-mail: info.aq-spec@aqmd.gov
PurpleAir PA II Information: retrieved 2019/03/07, original source: http://www.aqmd.gov/aq-spec/product/purpleair-pa-ii [download failures 2019/03/07]PurpleAir PA II COUNTER INDEPENDENT TEST SUMMARY REPORT [PDF] South Coast AQMD retrieved 2019/03/07, original source: http://www.aqmd.gov/docs/default-source/aq-spec/summary/purpleair-pa-ii---summary-report.pdf?sfvrsn=10 [download failures 2019/03/07]
PurpleAir PA COUNTER INDEPENDENT TEST REPORT FIELD EVALUATION [PDF] South Coast AQMD retrieved 2019/03/07, original source: http://www.aqmd.gov/docs/default-source/aq-spec/field-evaluations/purple-air-pa-ii---field-evaluation.pdf?sfvrsn=4 [download failures 2019/03/07]
PurpleAir PA COUNTER INDEPENDENT TEST REPORT LAB EVALUATION [PDF] South Coast AQMD retrieved 2019/03/07, original source: http://www.aqmd.gov/docs/default-source/aq-spec/laboratory-evaluations/purple-air-pa-ii---lab-evaluation.pdf?sfvrsn=10 [download failures 2019/03/07]
PurpleAir PA COUNTER SPECIFICATIONS [PDF]
PLANTOWER PMS5003 LASER COUNTER MANUAL [PDF] (Used in the PurpleAir PM Counter) Plantower retrieved 2019/03/07, retrieved 2019/03/07 from
http://www.aqmd.gov/docs/default-source/aq-spec/resources-page/plantower-pms5003-manual_v2-3.pdf?sfvrsn=2 (from SouthCoast 2019/03/07)
original source: http://www.aqmd.gov/docs/default-source/aq-spec/resources-page/plantower-pms5003-manual_v2-3.pdf [download failures 2019/03/07]
- PURPLEAIR PM COUNTER SPECIFICATIONS [PDF] PurpleAir, Air Quality Monitoring Network, Website: https://www.purpleair.com retrieved 2019/03/07, original source: https://www.purpleair.com/technology
Website excerpts:
Who is PurpleAir and how did this get started?
We are a grassroots group with a technical background that wanted to measure the pollution coming from a mining operation in our backyard. The website and map was started in November 2015. Sharing the data and our research with others created a need for more monitors, to expand the network and to test the sensors by collocating them with other monitors.
What do the numbers on the PurpleAir map mean?
The PurpleAir Map displays the points using the Federal Environmental Protection Agency (EPA) Air Quality Index (AQI) scale.
The AQI allows comparison for different pollutants with an easy to visualize color scheme.
The air goes from good green air to yellow to orange to red to purple air, or even hazardous maroon air. The graphs give further information on different counts, relative weights and sizes of particles in the air.
Is PurpleAir a non-profit organization?
PurpleAir operate under an llc. We reached this point by using our own resources, some donations and help from friends.
Due to numerous requests for sensors, in late February 2016 PurpleAir accepted pre-orders of a small batch of prototype sensors. Since that time, we have made over 500 air quality sensors.
- U.S. EPA, WHAT ARE THE AIR QUALITY STANDARDS FOR PM ? [PDF], U.S. Environmental Protection Agency, Region 1: New England, retrieved 2018/07/20, original source: https://www3.epa.gov/region1/airquality/pm-aq-standards.html
Excerpts:
In July 1997, after evaluating hundreds of health studies and conducting an extensive peer-review process, EPA established PM standards that specifically addressed particles smaller than 2.5 microns (PM2.5).... On December 14, 2012, EPA finalized an update to the National Ambient Air Quality Standard for PM2.5. The annual [airborne PM 2.5 particle exposure] standard was reduced from 15 μg/m3 to 12 μg/m3.
The daily [airborne PM 2.5 particle exposure] standard and standards for PM10 were retained. The revised 2012 PM standard became effective on March 18, 2013.
Primary standards set limits to protect public health, including the health of "sensitive" populations such as asthmatics, children, and the elderly.
Secondary standards set limits to protect public welfare, including protection against decreased visibility, damage to animals, crops, vegetation, and buildings. - WHO AIR QUALITY GUIDELINES FOR PARTICULATE MATTER, OZONE, NITROGEN DIOXIDE AND SULFUR DIOXIDE (2005) [PDF], World Health Organization, retrieved 2018/07/02, original source: http://apps.who.int/iris/bitstream/handle/10665/69477/WHO_SDE_PHE_OEH_06.02_eng.pdf?sequence=1
Identification of Types of Airborne Particles: San Miguel de Allende
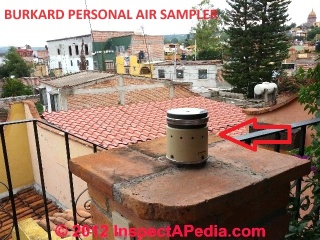 Using a Burkard personal air sampler (photo at left) allows high portability and airborne particle concentration sampling in a variety of locations and under varying conditions.
As additional samples are collected and analyzed in our local microscopy lab we will add to the data air quality information describing air samples collected during varying seasons, times of day, and weather conditions.
If our study observes particularly high levels of known or suspected airborne irritants such as common allergens, pollen, or mold (airborne fungal spores) we will note those conditions as well.
Notice: This is an independent, un-funded, private study whose results are shared with the public.
These results are in no way "official" and cannot be taken as representative of air quality conditions other than for the specific date, time, and location where samples were collected.
We welcome questions or suggestions about this material: please use the Q&A box found at the end of this article.
Air Sample Results for San Miguel de Allende, Guanajuato, Mexico |
|
|---|---|
| Aerobiological Particles [1] | Particles per M3 of air [1] |
| Alternaria sp. | 88 |
| Algae | 13 |
| Amerospores | 50 |
| Ascomycetes | 350 |
| Basidiomycetes | 13 |
| Bipolaris/Drechs- lera group |
13 |
| Cladosporium sp. | 450 |
| Hyphal fragments | 88 |
| Insect fecals | 13 |
| Periconia sp. | 13 |
| Pithomyces sp. | 26 |
| Plant hairs fibers | 13 |
| Pollen (sum) | 38 |
| Unid. mitospores | 38 |
| Total biologicals | 1312 |
| Non-biological particles | |
| Fabric fibers | 13 |
| Road dust/tire particles | 38 |
| Road dust / mineral or soil
particles from 1u to 150u, adhered clusters counted as 1 particle |
>50,000 estimated, <20% of trace counted |
| Total non-biologicals | >50,050 |
| Total particles | >53,000 per M3 of air |
Notes to the table above
[1] 05 Jul 2012, 16:00 hrs.
Col. San Antonio, outdoors, 2nd fl, 16:00 hrs, sun, recent rain, wind < 10 kph.
Burkard PAS, 80L, KOH, 400x & 1000x, 100% of trace was counted for fungal spores & pollen
In the road dust bacterial or viral adherents to non-biological dust particles could be present but are not included in this analysis.
Summary: sample dominated by Cladosporium sp., Ascomycetes, and non-fungal mineral-dust particles. Soil particles including ultra-fines, high.
Pollen count: low. Total particle count: low.
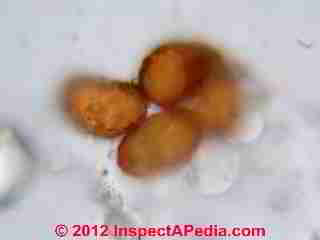
Photographs of Airborne Particles From the Air Samples in the Table Above

5 Jul 2012, 4PM Col. San Antonio
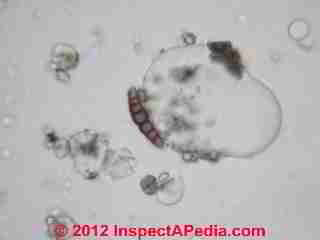
Ascomycete cluster & soil particles - above
smut spore cluster - below
Research on Air Contaminants in San Miguel de Allende, Mexico: types of airborne pollutants
 Some readers asked about testing San Miguel de Allende air for dioxins - not something that is considered in the aerobiological and dust characterization study (still in process) described above.
Dioxins and PCBs can be airborne contaminants as cited in the references below as may a great many other potential airborne pollutants arising from various business activities including fabrication, chemical and municipal waste burning (Czuczwa 1986).
Tire burning that has occurred around San Miguel de Allende and countless other cities around the world is a common source of heavy metal pollution.
- Alcock, Ruth E., Peter A. Behnisch, Kevin C. Jones, and Hanspaul Hagenmaier. "Dioxin-like PCBs in the environment-human exposure and the significance of sources." Chemosphere 37, no. 8 (1998): 1457-1472.
- Blackman, Allen, ed. Small Firms and the Environment in Developing Countries:" Collective Impacts, Collective Action". Routledge, 2010. [The bricks on the cover of this book are from San Miguel de Allende]
- Booth, Shawn, Joe Hui, Zoraida Alojado, Vicky Lam, William Cheung, Dirk Zeller, Douw Steyn, and Daniel Pauly. "Global deposition of airborne dioxin."Marine pollution bulletin 75, no. 1 (2013): 182-186.
- Czuczwa, Jean M., and Ronald A. Hites. "Airborne dioxins and dibenzofurans: sources and fates." Environmental science & technology 20, no. 2 (1986): 195-200.
- Czuczwa, Jean M., and Ronald A. Hites. "Sources and fate of PCDD and PCDF." Chemosphere 15, no. 9 (1986): 1417-1420.
- Fiedler, H., O. Hutzinger, and C. W. Timms. "Dioxins: sources of environmental load and human exposure." Toxicological & Environmental Chemistry 29, no. 3 (1990): 157-234.
- Horner, Jonathan M. "Environmental health implications of heavy metal pollution from car tires." Reviews on environmental health 11, no. 4 (1996): 175-178.
- Kulkarni, Prashant S., João G. Crespo, and Carlos AM Afonso. "Dioxins sources and current remediation technologies—a review." Environment international 34, no. 1 (2008): 139-153.
- Kurokawa, Yoichi, Matsueda Takahiko, Nakamura Matayoshi, Takada Satoshi, and Fukamachi Kazumi. "Distribution of polychlorinated dibenzo-p-dioxins and dibenzofurans in various sizes of airborne particles." Chemosphere 37, no. 9 (1998): 2161-2171.
- Mandal, Prabir K. "Dioxin: a review of its environmental effects and its aryl hydrocarbon receptor biology." Journal of Comparative Physiology B 175, no. 4 (2005): 221-230.
- Mahlknecht, Jürgen, Ma Guadalupe Medina-Mejía, Jaime Gárfias-Solis, and Irene Cano-Aguilera. "Intrinsic aquifer vulnerability assessment: validation by environmental tracers in San Miguel de Allende, Mexico." Environmental geology 51, no. 3 (2006): 477-491.
- Mercado‐Silva, Norman, John Lyons, Edmundo Díaz‐Pardo, Altagracia Gutiérrez‐Hernández, Claudia Patricia Ornelas‐García, Carlos Pedraza‐Lara, and M. Zanden. "Long‐term changes in the fish assemblage of the Laja River, Guanajuato, central Mexico." Aquatic Conservation: Marine and Freshwater Ecosystems 16, no. 5 (2006): 533-546.
- Safe, Stephen. "Polychlorinated biphenyls (PCBs), dibenzo-p-dioxins (PCDDs), dibenzofurans (PCDFs), and related compounds: environmental and mechanistic considerations which support the development of toxic equivalency factors (TEFs)." CRC Critical Reviews in Toxicology 21, no. 1 (1990): 51-88.
- Ziadat, Anf H., and Emad Sood. "An Environmental Impact Assessment of the Open Burning of Scrap Tires." Journal of Applied Sciences 14, no. 21 (2014): 2695.
- BJ Fairless et als, "Procedures used to measure the amount of 2,3,7,8-tetrachlorodibenzo-p-dioxin in the ambient air near a Superfund site cleanup operation", Environ. Sci. Technol., 1987, 21 (6), pp 550–555, June 1987
- Marie-Louise Scipp, et als, "DR-CALUX® screening of food samples: evaluation of the quantitative approach to measuredioxin, furans and dioxin-like PCBs", Talanta, Volume 63, Issue 5, 8 August 2004, Pages 1193–1202
- AIR QUALITY STUDY San Miguel de Allende
- AIRBORNE MOLD SPORE COUNT GUIDE - home
- AIRBORNE PARTICLE LEVELS vs IAQ - home
- AIRBORNE PARTICLE ANALYSIS METHODS - How do we count airborne particles, How to Convert Particle Mass Measurements in mg/M3 to Particle Count Measurements for PM 2.5 & Other Sizes
- AIRBORNE PARTICLE COUNT LIVE DATA SAN MIGUEL de ALLENDE
- INDOOR AIR QUALITY IMPROVEMENT GUIDE - home
- INDOOR AIR POLLUTION - CPSC GUIDE
- WATER QUALITY & QUANTITY San Miguel de Allende
- WEATHER in SAN MIGUEL de ALLENDE
- In addition to citations & references found in this article, see the research citations given at the end of the related articles found at our suggested
CONTINUE READING or RECOMMENDED ARTICLES. - Carson, Dunlop & Associates Ltd., 120 Carlton Street Suite 407, Toronto ON M5A 4K2. Tel: (416) 964-9415 1-800-268-7070 Email: info@carsondunlop.com. Alan Carson is a past president of ASHI, the American Society of Home Inspectors.
Thanks to Alan Carson and Bob Dunlop, for permission for InspectAPedia to use text excerpts from The HOME REFERENCE BOOK - the Encyclopedia of Homes and to use illustrations from The ILLUSTRATED HOME .
Carson Dunlop Associates provides extensive home inspection education and report writing material. In gratitude we provide links to tsome Carson Dunlop Associates products and services.
...
Reader Comments, Questions & Answers About The Article Above
Below you will find questions and answers previously posted on this page at its page bottom reader comment box.
Reader Q&A - also see RECOMMENDED ARTICLES & FAQs
On 2018-02-08 by (mod) -
Betty
What's in the air varies enormously by season, weather, and proximity to particle or irritant or contaminant sources.
living next to a dump burning tires, for example, is more troublesome than living a few kilometers away.
Generally the dominant particles in San Miguel air away from specific problem sources are fine soil debris.
On 2018-02-08 by Betty Bellomy
Could you please summarize your findings in layman’s terms? It would take us days to look up the definition of all those terms in your graph.
Having dealt with severe allergies and respiratory infection from dust since November, I AM curious about the spores, feces, salmonella, and allergens that are in the dust and swirling around us in the often heavy winds.
On 2012-07-27 by (mod) - concern for San Miguel de Allende air quality impact of burning tires and waste for brick production
William, thanks for your question. Tests for dioxin would need to be made not just in air but in soil and water, typically starting closest to suspected sources. There are of course additional tests to screen humans or animals for dioxin.
While I'm familiar with the issues, dioxin screening is not within my area of expertise.
We might want to review some of the expert literature for a better grasp of the best approach. See for example,
On 2012-07-25 by William McLeod
We are a group concerned with air quality in San Miguel. Our concern is not dust, pollen, etc. that you measured, but rather dioxins and other toxins produced by burning tires, plastic, electrical components and so forth.
These are the fuels used for making bricks here, and their is open burning as well.
Do you have the capability of measuring any of these contaminants? If so, we would like to talk with you. These are the real hazards in San Miguel, and the sites of the ovens are south of the center and drift covering the bowl formed by ring of mountains in San Miguel.
Like the types of things you are presently measuring, they are not airborne much at this time of year as dust storms, and smoke drifts are more seasonal. The time of year when it is particualarly bad is late winter and spring.
...
Continue reading at AIRBORNE PARTICLE COUNT LIVE DATA SAN MIGUEL de ALLENDE or select a topic from the closely-related articles below, or see the complete ARTICLE INDEX.
Or see these
Recommended Articles
Suggested citation for this web page
AIR QUALITY STUDY San Miguel de Allende at InspectApedia.com - online encyclopedia of building & environmental inspection, testing, diagnosis, repair, & problem prevention advice.
Or see this
INDEX to RELATED ARTICLES: ARTICLE INDEX to TRAVEL, STUDIES, RESEARCH MEXICO U.K. NEW ZEALAND & MORE
Or use the SEARCH BOX found below to Ask a Question or Search InspectApedia
Or See
INDEX to RELATED ARTICLES: ARTICLE INDEX to BUILDING INDOOR AIR QUALITY IAQ
Or use the SEARCH BOX found below to Ask a Question or Search InspectApedia
Ask a Question or Search InspectApedia
Try the search box just below, or if you prefer, post a question or comment in the Comments box below and we will respond promptly.
Search the InspectApedia website
Note: appearance of your Comment below may be delayed: if your comment contains an image, photograph, web link, or text that looks to the software as if it might be a web link, your posting will appear after it has been approved by a moderator. Apologies for the delay.
Only one image can be added per comment but you can post as many comments, and therefore images, as you like.
You will not receive a notification when a response to your question has been posted.
Please bookmark this page to make it easy for you to check back for our response.
IF above you see "Comment Form is loading comments..." then COMMENT BOX - countable.ca / bawkbox.com IS NOT WORKING.
In any case you are welcome to send an email directly to us at InspectApedia.com at editor@inspectApedia.com
We'll reply to you directly. Please help us help you by noting, in your email, the URL of the InspectApedia page where you wanted to comment.
Citations & References
In addition to any citations in the article above, a full list is available on request.


