 Find leaks in gas piping
How to Identify & Correct LP Gas or Natural Gas Leaks
- POST a QUESTION or COMMENT about troubleshooting LP gas or natural gas leaks in gas piping or appliances
Detect or find gas leaks in natural gas or LP gas / propane piping, fittings, & appliances:
This article describes how to find gas leaks on LP or natural gas piping, regulators, or appliances, and it provides free sample draft home inspection report language for reporting defects in oil and gas piping at residential properties.
This article series provides descriptions and photographs of unsafe gas piping, indications of unsafe or improperly operating gas appliances, gas meters, and other gas installation defects are provided.
InspectAPedia tolerates no conflicts of interest. We have no relationship with advertisers, products, or services discussed at this website.
- Daniel Friedman, Publisher/Editor/Author - See WHO ARE WE?
How to Test or Look for LP Gas System Leaks
Here we outline some common procedures used to test gas piping and fittings for leaks. These procedures should work equally well for both LP gas (propane or bottled gas) systems and for natural gas (piped-in gas from a gas utility company) systems.
Watch out: improper installation and even improper inspection and testing methods involving natural or "LP" gas can involve dangerous conditions and risk fire or explosion.
If you smell gas you should leave the building immediately and should do so without doing anything that could create a spark such as operating a light switch or telephone.
From a safe location, call your gas company's emergency line and/or your fire department. The text provided here is a working draft and may be incomplete or inaccurate.
NOTICE: while example report language is provided here, reproduction of this or any of our web pages or their contents at other websites or in printed documents for sale is prohibited.
NOTE: Except that LP gas and natural gas operate at different pressures and thus
will have different test pressure specifications. Readers who are interested in gas leak detection equipment should review our article and gas testing warnings
at GAS DETECTION INSTRUMENTS which includes our description of use of the TIF8800 and similar gas detectors.
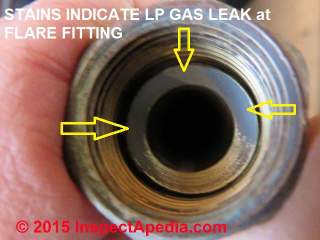
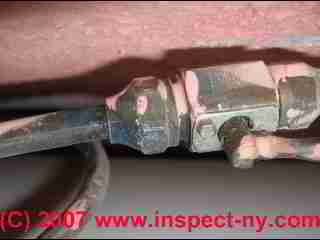
Our photo above of an LP gas line shutoff shows black staining around the shutoff valve and flare fitting, with some of the black worn away - previously there had been an LP gas leak at this location.
General Safety Warnings for Natural Gas, LP or "bottled" or "propane" Gas Installations & Inspections
Immediate LP or natural gas safety hazards: if there is evidence of an LP or natural gas leak at a building, gas odors, for example, you should:
- Do not do anything that is likely to cause a gas explosion, such as lighting a match, operating an electrical switch, or even using a telephone in the building
- Leave the building immediately and keep a safe distance away - 100 feet or more.
- Notify other building occupants of the safety concern
- Contact the local gas company and/or fire department
Heating equipment which the inspector (or building occupant or manager) judges to be an immediate life safety hazard should be shut down and appropriate emergency services called.
Pressure testing a gas piping system for evidence of gas leaks
 These two methods are generally used to test a gas piping distribution system to see if leaks are present.
- Low Pressure Method Gas leak tests by gas service technicians
generally include the following steps: - All gas piping connections, valves, and appliance connections and valves are inspected visually for tightness and good condition
- A gas pressure gauge [such as the Fisher™ Type 50P-2 gas pressure gauge] is connected to a burner orfice
- The gas service valve is opened to permit gas to flow into the gas piping distribution system, and then the valve is closed again, securely
- The gas pressure gauge should read eight inches of water column in pressure (previously 9 inches, earlier eleven inches of water column) and should hold steady.
- The gas pressure at the point of testing, say a gas-fired heating appliance, is bled off slowly until the gas pressure test instrument gauge indicates nine inches of water column.
- The system is monitored for any pressure drop for at least three minutes. If no pressure drop is detected the system is considered not leaking.
- High pressure gas leak method is also used by gas service technicians and includes steps similar to those above, using a special fitting [such as the Fisher(TM) Type J600 test block] installed between the service valve outlet port at the LP gas tank.
- The service valve is opened,as above, to pressurize the gas piping, and the system is bled down to a test pressure of 10 psig, then monitored for at least three minutes to check for a pressure drop.
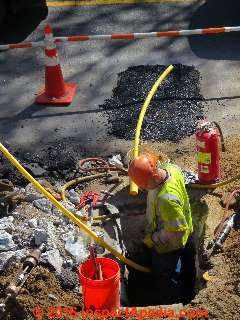
Our photo above shows Con Edison workers performing gas line replacement & repair work on Washington Avenue in Brooklyn, NY in April 2015.
In 2015 the National Transportation Board found that in 2014 a large gas explosion in East Harlem in Brooklyn NY that destroyed two five-story buildings and killed eight people was probably caused by a poorly welded joint in a Con Edison gas line and a break in an old city sewer line.
The NTSB previously noted a leaky cast iron gas main that had been installed in 1887.
Thanks to reader Tony Martinez for updating our data on the proper pressure for LP or Natural Gas leak testing. Thanks to another reader JR, an industry manager familiar with gas pressures, who adds that these two fuel gases operate at different pressures. In residential appliances
- Natural Gas system pressure:
Natural gas operates at a nominal pressure of 7” WC (about 0.253 psi) - LPG or Liquid Propane Gas system pressure:
LP gas or propane operates at a nominal pressure of 11” WC (about 0.397 psi) - Actual NG or LPG gas pressures vary:
[Note: the exact pressure you see in the building at an appliance may vary from these numbers depending on the gas distribution piping system size, diameter, number of appliances served, number of appliances operating, regulator adjustment, and other factors.
See GAS REGULATORS & APPLIANCE / HEATER CONTROLS
and GAS REGULATORS for LP TANKS.
See LP or NATURAL GAS PRESSURES for a table showing the range of variation in LP gas pressure in the tank at various temperatures. - Ed.]
and adds:
Watch out: Extinguish gas pilot lights - in order to perform pressure-testing methods for LP or natural gas leak detection as discussed above, you will need to extinguish the pilot lights on all gas-fired appliances in the building, and the pilot lights will need to be re-lit again after testing is complete.
Methods used to find and identify points of gas leaks in a gas piping distribution system or at a gas appliance
- Visual Inspection for Evidence of Gas Leaks in fuel gas lines and appliances:
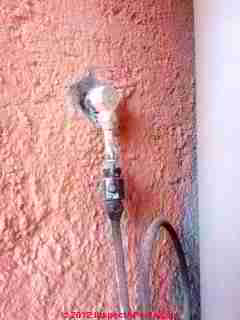
Our photograph below shows black stains on copper tubing at the flare fitting connecting an LP gas line to a shutoff valve and at below right stains inside of a flare fitting on LPG piping.
Some service technicians point to these stains on piping as an evidence of a possible chronic leak in the gas line at this point.
Indeed on disassembly of a 15-year old LP gas cooktop installed in a New York home I [DF] found this black-stained flare fitting at the connection to the gas inlet nipple of the cooktop.
Owners had occasionally smelled a whiff of LP gas but had been unable to find its source, thinking perhaps it was coming from the burners themselves. It wasn't .
See GAS COOKTOP INSTALLATION for photos of the old and new gas appliances involved.
Protracted leakage of fuel gas from a fitting can eventually leave black stains such as shown on the exterior of the flare fitting at above left and the interior of the flare fitting shown at above right.
- Gas odors
observed during gas piping inspection: The mercaptan put into LP gas and natural gas is inserted there by the gas company as a safety feature so that people may notice that they have a dangerous (explosive) gas leak in their home. Some people may confuse this odor with a septic tank gas odor.
See SEWER GAS ODORS for a discussion of sewer gas odors.
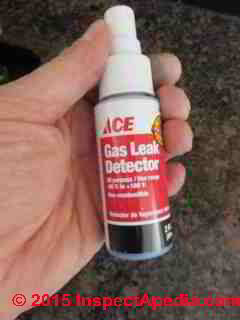
- "Soap solution" bubble tests for gas leaks:
a solution of soapy water (some technicians use dish soap and a brush or rag) is the most common method used to test for gas leaks.
As we noted earlier, Readers who are interested in gas leak detection equipment should review our article and gas testing warnings
at GAS DETECTION INSTRUMENTS which includes our description of use of the TIF8800 and similar gas detectors. - Soap solution is applied at every piping joint or connection (or the test instrument may be used carefully at and around every
connection or other suspect point) and the technician watches the soaped connection to see if soap bubbles are formed. Experts warn
that this method requires some experience and care.
For example, a large gas leak may blow away the solution without forming a soap bubble, or bubbles may be forming in a location which is physically hard to see.
Sometimes we can "see" around a corner or to the back side of a pipe using our TIF 8800 combustible gas detector in these cases. - Soap solution is applied along gas piping to lengths of piping to test for pinholes or mechanical damage if no leaks are found at threaded
or flared connectors but when gas leaks are evident in the system.
An example of using soap solution to check for gas leaks is found
at GAS COOKTOP INSTALLATION - Gas leaks at gas valves:
we very often find very small gas leaks at the seamed sides of some gas valves, such as those commonly found on gas-fired domestic water heaters, especially when using the TIF 8800.
These leaks can be so miniscule that they do not show up during a bubble test, and they are often present even on new valves.
This may be a source of some disagreement between a home inspector, building owner, and the gas service technician, and need to be handled with some judgment, experience, and reason.
Identifying Sources of Leaks at Brass Flare Fittings on LP Gas Piping Systems
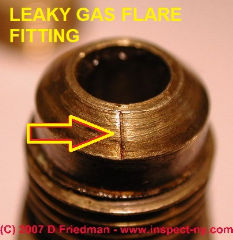
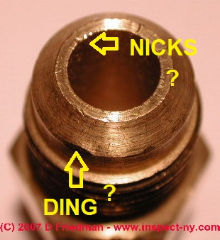
Here are two brass flare fittings. One of them had a gouge that gave us a gas leak that was a bit tough to find until we disassembled and inspected the leaky joint.
The second, below, had a few microscopic nicks at the inner edge of its orifice and a tiny dent in the outer edge of its sealing bevel, but was in good enough shape that it does not leak.
Watch out: If tightening flared copper tubing connections does not easily correct a leak at that joint, do not just over-tighten the joint (you may break the flare and cause a still larger leak), and do not rely on pipe sealant inside of flared copper tubing fittings.
Open and inspect the flare fitting joint, and replace the flare fittings or make a new copper tubing flared end if necessary.
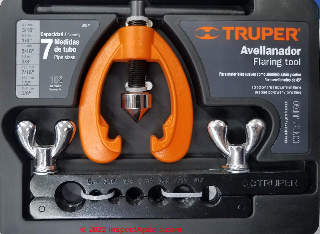
Watch out: a poorly-made flare on the copper tubing end can also cause leaks; inspect the tubing flare for nicks, tears, cuts, or deep gouges. If it's damaged you'll have to cut off the flared end and form a new flare flange.
Also see REFRIGERANT TUBING FLARE CONNECTIONS where we describe preparation of the flare joint for flexible copper tubing for refrigeration or gas piping lines.
There we also describe using a swaging tool to enlarge the end of copper tubing to make a soldered or brazed connection that is leak-proof.
Gas Leak Rates & Volumes
Question: 1mm sq hole in a domestic Gas pipe that went undetected
Anon said:
I had a 1mm sq hole in a domestic Gas pipe that went undetected for 4 years if on average the gas heating was on for 1 hour every day how much gas would i have lost at 1/4PSI
Reply:
Gas pipe leak calculation:
Assumptions for Gas Leak Rates Through an Orifice:
- An ambient temperature of 65 degF, ("Normal temperature and pressure" are usually defined as 20 degC or 68 degF and 1 ATM)
- An outside relative pressure of zero (1 ATM),
- A gas piping internal pressure of 0.25 psig,
- A 1 mm hole (round, 1mm. diameter)
- Assuming no significant difference in the density of the gas from air
(which is not correct unless your fuel was natural gas but simplifies the calculation)
- Air has a density of about 1.2 - 1.3 kg/m3 or about 0.72 - 0.8 lb/ft3
- Methane has a density of about 0.67-7.1 kg/m3 or about 0.42 - 0.45 lb/ft3
- Natural gas has a density of about 0.7 - 0.9 kg/m3 or about 0.44 - 0.56 lb/ft3
- Propane has a density of about 1.9 kg/m3 or about 0.12 lb/ft3
- Assuming the leak was actually exposed to open air during that time, was unaffected by wind, temperature, rain, nor any blockage (such as soil or corrosion or debris).
Using an engineering calculator on gas (air) flow rate, the leak rate would have been
0.0614345 SCFM (standard cubic feet per minute)
Calculating the Total Volume of Gas Leaked Over an Interval
using
- your assumption that the leak only occurred when the heat was "on" thus assuming that the leak occurred only when a gas valve was open,
- assuming a leak interval of one hour per day
- assuming that your "on" time of one hour per day continued for 180 days per year (I doubt your heat was on 24/7 for four years)
We calculate the gas leak quantity as follows
0.0614345 SCFM leak rate x 60 minutes per hour = 3.7 cubic feet per hour
3.7 CU Ft / Hr / day x 180 days/year x 4 years = 2,664 cubic feet of gas lost to the air
Happily you and your building didn't suffer a fire, explosion or other catastrophe
- Engineering calculation of air flow rates: See "Air Flow Rate through an Orifice" calculator at http://www.tlv.com/global/TI/calculator/air-flow-rate-through-orifice.html
Gas Appliance Leak Research
- Fischer, Marc L., Wanyu R. Chan, Woody Delp, Seongeun Jeong, Vi Rapp, and Zhimin Zhu. "An estimate of natural gas methane emissions from California homes." Environmental science & technology 52, no. 17 (2018): 10205-10213.
Abstract:
We estimate postmeter methane (CH4) emissions from California’s residential natural gas (NG) system using measurements and analysis from a sample of homes and appliances. Quiescent whole-house emissions (i.e., pipe leaks and pilot lights) were measured using a mass balance method in 75 California homes, while CH4 to CO2 emission ratios were measured for steady operation of individual combustion appliances and, separately, for transient operation of three tankless water heaters.
Measured quiescent whole-house emissions are typically <1 g CH4/day, though they exhibit long-tailed gamma distributions containing values >10 g CH4/day. Most operating appliances yield undetectable CH4 to CO2 enhancements in steady operation (<0.01% of gas consumed), though storage water heaters and stovetops exhibit long-tailed gamma distributions containing high values (∼1–3% of gas consumed), and transients are observed for the tankless heaters.
Extrapolating results to the state-level using Bayesian Markov chain Monte Carlo sampling combined with California housing statistics and gas use information suggests quiescent house leakage of 23.4 (13.7–45.6, at 95% confidence) Gg CH4, with pilot lights contributing ∼30%.
Emissions from steady operation of appliances and their pilots are 13.3 (6.6–37.1) Gg CH4/yr, an order of magnitude larger than current inventory estimates, with transients likely increasing appliance emissions further.
Together, emissions from residential NG are 35.7 (21.7–64.0) Gg CH4/yr, equivalent to ∼15% of California’s NG CH4 emissions, suggesting leak repair, improvement of combustion appliances, and adoption of nonfossil energy heating sources can help California meet its 2050 climate goals. - Geocities: geocities.com/rainforest/6847/report1.html is an interesting and detailed though not “neutral” report on the components and contaminants in the combustion of natural gas. You’ll see a long long list of emissions products, but look again – most of the contaminant levels listed are in the picograms.
- THE TRUTH ABOUT GAS LEAKAGE COMPLAINTS and GAS VALVES [PDF] -(1994) original source: Honeywell Corporation (1994), www.graycoolingman.com/uploads/1/0/6/6/10667336/honeywell_gas_valve_leakage.pdf
Excerpt:
ANSI allows 200 cc/hr for outer wall gas leakage and 235 cc/hr for valve gas leakage - Lebel, Eric D., Colin J. Finnegan, Zutao Ouyang, and Robert B. Jackson. METHANE AND NO X EMISSIONS FROM NATURAL GAS STOVES, COOKTOPS, AND OVENS IN RESIDENTIAL HOMES. [PDF] Environmental science & technology 56, no. 4 (2022): 2529-2539.
Abstract:
Natural gas stoves in >40 million U.S. residences release methane (CH4)─a potent greenhouse gas─through post-meter leaks and incomplete combustion. We quantified methane released in 53 homes during all phases of stove use: steady-state-off (appliance not in use), steady-state-on (during combustion), and transitory periods of ignition and extinguishment.
We estimated that natural gas stoves emit 0.8–1.3% of the gas they use as unburned methane and that total U.S. stove emissions are 28.1 [95% confidence interval: 18.5, 41.2] Gg CH4 year–1.
More than three-quarters of methane emissions we measured originated during steady-state-off. Using a 20-year timeframe for methane, annual methane emissions from all gas stoves in U.S. homes have a climate impact comparable to the annual carbon dioxide emissions of 500 000 cars.
In addition to methane emissions, co-emitted health-damaging air pollutants such as nitrogen oxides (NOx) are released into home air and can trigger respiratory diseases. In 32 homes, we measured NOx (NO and NO2) emissions and found them to be linearly related to the amount of natural gas burned (r2 = 0.76; p ≪ 0.01).
Emissions averaged 21.7 [20.5, 22.9] ng NOx J–1, comprised of 7.8 [7.1, 8.4] ng NO2 J–1 and 14.0 [12.8, 15.1] ng NO J–1. Our data suggest that families who don’t use their range hoods or who have poor ventilation can surpass the 1-h national standard of NO2 (100 ppb) within a few minutes of stove usage, particularly in smaller kitchens. - Lebel, Eric D., Harmony S. Lu, Simone A. Speizer, Colin J. Finnegan, and Robert B. Jackson. "Quantifying methane emissions from natural gas water heaters." Environmental science & technology 54, no. 9 (2020): 5737-5745.
Abstract:
Methane emissions from natural gas appliances remain the least characterized portion of the fossil-fuel supply chain. Here we examine water heaters from 64 northern California homes to (1) quantify methane emissions from natural gas leaks and incomplete combustion while off, turning on or off, and in steady-state operation from 35 homes; and (2) characterize daily usage patterns over ∼1–2 months per water heater to estimate activity factors from 46 homes.
Individual tankless water heaters emitted 2390 [95% CI: 2250, 2540] g CH4 yr–1 on average, 0.93% [0.87%, 0.99%] of their natural gas consumed, primarily from on/off pulses. Storage water heaters emitted 1400 [1240, 1560] g CH4 yr–1 on average, 0.39% [0.34%, 0.43%] of their natural gas consumption. Despite higher methane emissions, tankless water heaters generate 29% less CO2e20 than storage water heaters because they use less energy to heat a unit of water.
Scaling our measured emissions by the number of storage and tankless water heaters in the United States (56.8 and 1.2 million, respectively), water heaters overall emitted an estimated 82.3 [73.2, 91.5] Gg CH4 yr–1, 0.40% [0.35%, 0.44%] of all natural gas consumed by these appliances, comparable in percentage to the EPA’s estimate of methane emissions from upstream natural gas production. - Michanowicz, Drew R., Archana Dayalu, Curtis L. Nordgaard, Jonathan J. Buonocore, Molly W. Fairchild, Robert Ackley, Jessica E. Schiff et al. HOME is WHERE the PIPELINE ENDS: characterization of volatile organic compounds present in natural gas at the point of the residential end user. Environmental Science & Technology 56, no. 14 (2022): 10258-10268.
Abstract
The presence of volatile organic compounds (VOCs) in unprocessed natural gas (NG) is well documented; however, the degree to which VOCs are present in NG at the point of end use is largely uncharacterized. We collected 234 whole NG samples across 69 unique residential locations across the Greater Boston metropolitan area, Massachusetts.
NG samples were measured for methane (CH4), ethane (C2H6), and nonmethane VOC (NMVOC) content (including tentatively identified compounds) using commercially available USEPA analytical methods. Results revealed 296 unique NMVOC constituents in end use NG, of which 21 (or approximately 7%) were designated as hazardous air pollutants.
Benzene (bootstrapped mean = 164 ppbv; SD = 16; 95% CI: 134–196) was detected in 95% of samples along with hexane (98% detection), toluene (94%), heptane (94%), and cyclohexane (89%), contributing to a mean total concentration of NMVOCs in distribution-grade NG of 6.0 ppmv (95% CI: 5.5–6.6).
While total VOCs exhibited significant spatial variability, over twice as much temporal variability was observed, with a wintertime NG benzene concentration nearly eight-fold greater than summertime.
By using previous NG leakage data, we estimated that 120–356 kg/yr of annual NG benzene emissions throughout Greater Boston are not currently accounted for in emissions inventories, along with an unaccounted-for indoor portion.
NG-odorant content (tert-butyl mercaptan and isopropyl mercaptan) was used to estimate that a mean NG-CH4 concentration of 21.3 ppmv (95% CI: 16.7–25.9) could persist undetected in ambient air given known odor detection thresholds. This implies that indoor NG leakage may be an underappreciated source of both CH4 and associated VOCs.
Excerpt:
Also, while more data is needed relating to behind-the-meter NG leakage, home inspectors and contractors serving in that capacity could easily perform NG-appliance leak detection surveys with measurement devices that detect in the low ppmv range, similar to radon tests done prior to the completion of a real estate transaction. - National Fuel Gas Code, 1988 articles 2.6.2, 2.6.3, & 3.4.2 "Piping in Partitions". Also NFPA 58 Code. See ANSI Z223.1-NFPA 54.
- Oliphant, M. "Impact of Gas distribution leakage on gas appliance greenhouse effect." Clean Air: Journal of the Clean Air Society of Australia and New Zealand 28, no. 3 (1994): 24-31.
- Residential Gas Hot Water Heater Pocket Partner - Testing and Trouble Shooting, State Corp., Ashland City, TN 37015
- Saint-Vincent, Patricia MB, and Natalie J. Pekney. "Beyond-the-meter: Unaccounted sources of methane emissions in the natural gas distribution sector." Environmental science & technology 54, no. 1 (2019): 39-49.
Abstract excerpts:
The United States Environmental Protection Agency maintains an inventory of greenhouse gas emissions ....
However, the inventory also does not account for all possible sources of CH4 leaks, contributing to uncertainty in the national CH4 inventory. Discrepancies between top-down and bottom-up inventories of CH4 emissions imply that there are significant unaccounted-for sources of CH4 leaks, especially over cities.
Diffuse CH4 plumes above cities that are not attributable to distribution pipelines or other NG infrastructure suggest many small beyond-the-meter leaks together contribute to large emissions. Here, we evaluate the distribution sector of the CH4 emissions inventory and make suggestions to improve the inventory by analyzing end-user emissions. Preliminary research into beyond-the-meter emissions suggests that while individually small, the appliances and buildings that make up the residential sector could contribute significantly to national scale emissions.
Furnaces are the most leak-prone of appliances, contributing to 0.14% of total CH4 emissions from the NG sector in the United States. Combining measurements from whole house emissions and steady-state operation of appliances, we estimate that residential homes and appliances could release 9.1 Gg CH4 yearly in the United States, totaling over 2% of the CH4 released from the NG sector.
While factors such as appliance age and usage, climate, and residential setting could influence the emissions profile of individual appliances, these preliminary estimates justify further exploration of beyond-the-meter emissions. - U.S. Energy Information Administration - eia.doe.gov/
- U.S. Environmental Protection Agency - epa.gov/solar/energy-and-you/affect/natural-gas.html
- US EPA, HOUSEHOLD ENERGY & CLEAN AIR - retrieved 2023/02/01, original source: https://www.epa.gov/indoor-air-quality-iaq/household-energy-and-clean-air
- Natural Gas.Org Web: http://naturalgas.org/overview/, at www.naturalgas.org/environment/naturalgas.asp#emission previously published a table of combustion products - removed as of our last check (January 2023) [Ed.]
- Tian, Xinghao, Wenling Jiao, Tianjie Liu, Lemei Ren, and Bin Song. "Leakage detection of low-pressure gas distribution pipeline system based on linear fitting and extreme learning machine." International Journal of Pressure Vessels and Piping 194 (2021): 104553.
Abstract:
Pipelines are the lifeblood of the natural gas market. Compared with the high-pressure long-distance pipeline system and medium-pressure municipal pipeline system, the leak detection of low-pressure gas distribution pipeline system inside buildings that only relies on the combustible gas alarm is relatively backward and passive.
Based on the principle of the negative pressure wave method, we proposed a leak detection method combining linear fitting and extreme learning machine leak detection. We designed and built a low-pressure gas pipeline system, which truly reproduces the gas leakage scenes inside buildings.
By establishing multi-dimensional sliding windows, combined with a linear fitting method, the original pressure signal can be initially screened.
Small leakage and pipe network fluctuations can be effectively identified by the windows. For medium leakage, large leakage, and gas usage that are easy to be confused, the windows will accurately identify the inflection point of the pressure drop for subsequent processing.
Aiming at the characteristics of negative pressure waves, we extracted 15-dimensional feature vectors by dividing different stages.
After introducing extreme learning machine for training, the detection accuracy of the final model can reach more than 90 %. Compared with support vector machines and back propagation neural networks, the trained extreme learning machine model has higher accuracy and higher speed.
The joint leak detection algorithm based on linear fitting and extreme learning machine can greatly reduce the number of gas leakage accidents of low-pressure gas pipeline system through single point pressure monitoring. We applied the artificial intelligence algorithm and negative pressure wave to the low-pressure pipeline system for the first time, and established a new pressure wave processing method, characteristic model and algorithm model, which has a good engineering application prospect and theoretical significance. - WHO, HOUSEHOLD AIR POLLUTION, Key Facts [PDF] World Health Organization, retrieved 2023/02/01, original source: https://www.who.int/news-room/fact-sheets/detail/household-air-pollution-and-health
- Zhang, M., Gao, L., Wang, Q., Xie, D., Gao, J., Wang, S. and Lu, X., 2022. Methane Leakage Measurement of Natural Gas Heating Boilers and Greenhouse Gas Emissions Accounting of “Coal-to-Gas” Transition for Residential Heating in Rural Beijing. Environmental Science & Technology Letters.
...
Reader Comments, Questions & Answers About The Article Above
Below you will find questions and answers previously posted on this page at its page bottom reader comment box.
Reader Q&A - also see RECOMMENDED ARTICLES & FAQs
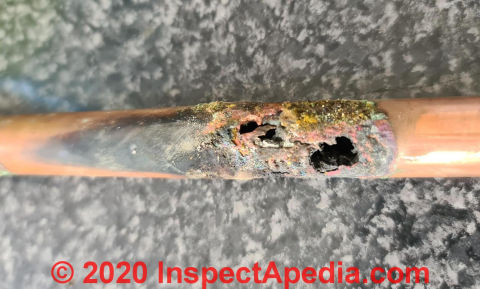
Question: how long did it take for this gas pipe leak to develop?
2020/06/28 joanne saho said:
I just had my gas safety checks done,
I had a bad leak, can anyone tell me how long it takes for a pipe to become this bad please
Moderator reply:
Joanne
Thanks for an interesting question, but not one I can answer as I've not a shred of information about the gas piping situation except that that looks like a copper pipe that is very badly corroded.
I don't know where it is, age, location, country, city, environment, indoor or outdoor exposure, etc, nor even if the pipe is in the position it was when the leak was discovered, nor even the fuel: LP gas (propane) or piped-in natural gas. (The properties of these two gases differ.)
I can offer:
From the very very localized area of damage, and in particular if this was the only point of damage, then something unusual was going on. It's possible that the gas line was in contact with a corrosive or vibrating surface, or that it was mechanically damaged earlier.
It's also possible that we're looking at a defect in the piping. Knowing exactly where the gas line was and how it was positioned and whether it was touching some other surface would be diagnostic.
It looks to me as if this leak may have been caused by an external condition - something touching, rubbing, or contacting the gas line. What is the age of the building and of the gas line? When was it installed. Where and how was it routed? Where exactly was this damaged gas line? What was it touching?
In your photo I see what looks like moss or algae near this large leak opening in the gas line. And in the background I see what looks like asphalt roofing shingle material.
Was this gas line in contact with a roofing surface and also perhaps in a low, wet spot. Could vibration combined with constant water have been factors in this leak?
Watch out: most serious in my opinion and based on this very incomplete information, is that a gas line opening of this size is enormous as gas leaks go. There would have been a tremendous rate of outlet of gas. Why was this leak not discovered much much sooner, when the leaky opening was pinhole sized?
Watch out: this gas leak is a very serious safety concern, as any gas leak gives the potential for a building fire or explosion or asphyxiation of the occupants (injury or death). So the first order of business is to
1. turn off the gas supply immediately if you smell gas or suspect a leak, then get out of the building and call for help
2. investigate the entire gas system in your building to be sure that there are no other safety concerns besides the one you've discovered.
More information about gas leaks and gas piping are above on this page and
at GAS PIPING CLEARANCES, CODES & DEFECTS
...
Continue reading at GAS DETECTION INSTRUMENTS or select a topic from the closely-related articles below, or see the complete ARTICLE INDEX.
Or see GAS LEAK DETECTION, LP / NG FAQs - questions and answers posted originally on this page.
Or see these
Recommended Articles
- GAS DETECTION INSTRUMENTS
- GAS EXPOSURE EFFECTS, TOXIC
- GAS EXPOSURE LIMITS & STANDARDS
- GAS EXPOSURE SCREENING TEST
- GAS LEAK DETECTION, LP / NG
- GAS PIPING CLEARANCES, CODES & DEFECTS
- GAS REGULATOR NOISES - may be due to leakage
- METHANE & SEWER GAS HAZARDS
- SEWER GAS ODORS
- TIF 8800 FIELD TEST
- TIF 8800 GAS DETECTOR
Suggested citation for this web page
GAS LEAK DETECTION, LP / NG at InspectApedia.com - online encyclopedia of building & environmental inspection, testing, diagnosis, repair, & problem prevention advice.
Or see this
INDEX to RELATED ARTICLES: ARTICLE INDEX to GAS HAZARDS in BUILDINGS
Or use the SEARCH BOX found below to Ask a Question or Search InspectApedia
Ask a Question or Search InspectApedia
Questions & answers or comments about troubleshooting LP gas or natural gas leaks in gas piping or appliances .
Try the search box just below, or if you prefer, post a question or comment in the Comments box below and we will respond promptly.
Search the InspectApedia website
Note: appearance of your Comment below may be delayed: if your comment contains an image, photograph, web link, or text that looks to the software as if it might be a web link, your posting will appear after it has been approved by a moderator. Apologies for the delay.
Only one image can be added per comment but you can post as many comments, and therefore images, as you like.
You will not receive a notification when a response to your question has been posted.
Please bookmark this page to make it easy for you to check back for our response.
IF above you see "Comment Form is loading comments..." then COMMENT BOX - countable.ca / bawkbox.com IS NOT WORKING.
In any case you are welcome to send an email directly to us at InspectApedia.com at editor@inspectApedia.com
We'll reply to you directly. Please help us help you by noting, in your email, the URL of the InspectApedia page where you wanted to comment.
Citations & References
In addition to any citations in the article above, a full list is available on request.
- apvgn.pt/documentacao/iangv_rep_part1.pdf lists the components in natural gas exhaust from vehicles
- The Need Project, Manassas, VA: need.org/needpdf/infobook_activities/SecInfo/NGasS.pdf
- Kroschwitz, Jacqueline I., and Mary Howe-Grant (eds.). "Gas, Natural." In Encyclopedia of Chemical Technology. 4th ed., vol. 12. New York: John Wiley and Sons, Inc., 1993.
- Tussing, Arlon R., & Bob Tippee. The Natural Gas Industry: Evolution, Structure, and Economics. 2nd ed. Tulsa, OK: PennWell Publishing, 1995.
- Thanks to reader Tony Martinez for technical editing regarding the test pressures for gas leak evaluation - 3/19/2010.
- Thanks to reader JR for discussing LP and natural gas operating pressures and leak detection safety, October 2010.
- Carbon Monoxide Gas Toxicity, exposure limits, poisoning symptoms, and inspecting buildings for CO hazards
- In addition to citations & references found in this article, see the research citations given at the end of the related articles found at our suggested
CONTINUE READING or RECOMMENDED ARTICLES.
- Carson, Dunlop & Associates Ltd., 120 Carlton Street Suite 407, Toronto ON M5A 4K2. Tel: (416) 964-9415 1-800-268-7070 Email: info@carsondunlop.com. Alan Carson is a past president of ASHI, the American Society of Home Inspectors.
Thanks to Alan Carson and Bob Dunlop, for permission for InspectAPedia to use text excerpts from The HOME REFERENCE BOOK - the Encyclopedia of Homes and to use illustrations from The ILLUSTRATED HOME .
Carson Dunlop Associates provides extensive home inspection education and report writing material. In gratitude we provide links to tsome Carson Dunlop Associates products and services.


