
InspectAPedia® FREE Encyclopedia of Building & Environmental Construction, Diagnosis, Maintenance & Repair |
Question? Just ask us! InspectAPedia
|
 Typical Levels of Carbon Dioxide Gas CO2 Normal Levels in Air Indoors & Outside
- POST a QUESTION or COMMENT about this article topic.
Typical CO2 - Carbon Dioxide Levels Indoors & Outside:
This document discusses the typical or normal levels of carbon dioxide gas (CO2) outdoors and inside buildings. We give references and explanation regarding Toxicity of Carbon Dioxide, based on literature search and search on Compuserve's Safety Forum by Dan Friedman. This is background information, obtained from expert sources.
This text may assist readers in understanding these topics. However it should by no means be considered complete nor authoritative. Seek prompt advice from your doctor or health/safety experts if you have any reason to be concerned about exposure to toxic gases. Links on this page also direct the reader to carbon monoxide gas information in a separate document.
InspectAPedia tolerates no conflicts of interest. We have no relationship with advertisers, products, or services discussed at this website.
- Daniel Friedman, Publisher/Editor/Author - See WHO ARE WE?
TYPICAL CO2 LEVELS Indoors and Outside
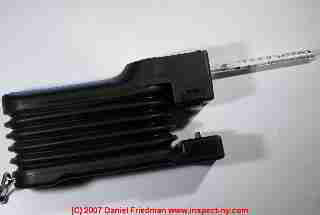
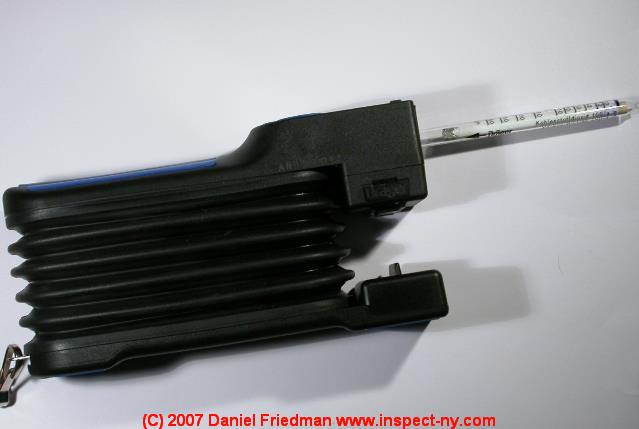
How to use gas detection tubes for measuring the level of various gases
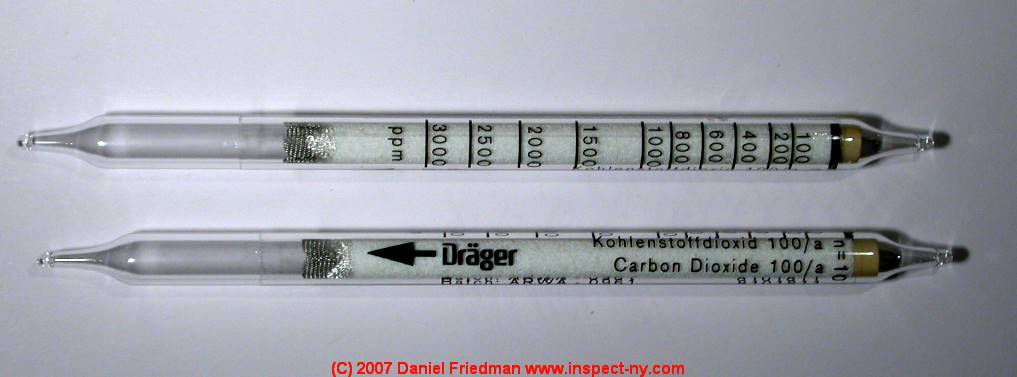
The colorimetric gas detection tubes, here showing a tube made by Drager, are a relatively inexpensive way to test for the level of specific gases.
The tubes are quite accurate and can be selected and used down to very low concentrations of various gases, provided that a properly chosen and calibrated gas testing pump is used. In some cases for very precise measurements a correction factor needs to be applied for temperature at the time of measurement.
We use Drager tubes as well as another system of tubes and pump made for and sold through GasTec for testing indoor levels of specific gases.
IF YOU SUSPECT ANY BUILDING GAS-RELATED POISONING GO INTO FRESH AIR IMMEDIATELY and get others out of the building, then call your fire department or emergency services for help.
What are the component gases that make up normal air and in what proportions or percentages do they ocur?
At sea level on earth, what is the composition of the air we breathe? That is, what gases make up normal outdoor air? How much CO2 is in air? How much oxygen is in air? and how much nitrogen is in the earth's atmosphere? Here is the mix of gases in normal outdoor air.
The earth's atmosphere (measured close to ground level) is made up of 78.1% nitrogen, 20.9% oxygen, 0.9% argon, 0.03% carbon dioxide, and 0.04% other gases. Let's look at some typical CO2 levels in both percentage and expressed in parts per million, which is how most instruments measure gas concentrations. [The mix of gases in air near some manufacturing facilities or in some cities may be a bit different.]
What are typical Carbon Dioxide levels in indoor and outdoor air?
- Carbon dioxide CO2 levels outdoors near ground level are typically 300 ppm to 400 ppm or 0.03% to 0.040% in concentration.
- Carbon dioxide CO2 levels indoors in occupied buildings are typically around 600 ppm to 800 ppm or 0.06% to 0.08% in concentration. You'll find this data in many indoor air quality articles and books and it's consistent with what we find typically in our own field measurements.
- Carbon dioxide CO2 levels indoors in an inadequately vented space with heavy occupation is often measured around 1000 ppm or 0.10% in concentration.
I have measured levels around 1200 ppm in occupied basement offices in a hospital where the staff worked in an area which had
no decent fresh air intake into their ventilation system. I
n 1989 I also measured 1200 ppm at chest height in the center of the sanctuary in a Jewish synagogue during the high holy days in a small New York city. I also observed people nodding off. We were never sure if it was a droning sermon, exhausted worshipers at the end of a long week, or the CO2 level. But there was no doubt that we were not meeting recommended ventilation standards for that space.
The US EPA warns that indoor ventilation is inadequate at CO2 levels of 1000ppm, [3] but for a more thorough discussion of toxicity of carbon dioxide see
CO2 POISONING SYMPTOMS
and
CO2 HEALTH EFFECTS - Carbon dioxide levels above 1500 to 2000 ppm are likely to be reached only in unusual circumstances (being enclosed in an airtight closet for a long time) or in industrial workplace settings such as we cited above.
Carbon Dioxide CO2 Sources in the Atmosphere & Carbon Dioxide CO2 Level Changes as a Greenhouse Gas
According to the US EPA's overview data:
Carbon dioxide (CO2) is emitted in a number of ways. It is emitted naturally through the carbon cycle and through human activities like the burning of fossil fuels.
Natural sources of CO2 occur within the carbon cycle where billions of tons of atmospheric CO2 are removed from the atmosphere by oceans and growing plants, also known as ‘sinks,’ and are emitted back into the atmosphere annually through natural processes also known as ‘sources.’ When in balance, the total carbon dioxide emissions and removals from the entire carbon cycle are roughly equal.
Since the Industrial Revolution in the 1700’s, human activities, such as the burning of oil, coal and gas, and deforestation, have increased CO2 concentrations in the atmosphere. In 2005, global atmospheric concentrations of CO2 were 35% higher than they were before the Industrial Revolution. For more information on CO2 trends in the atmosphere, visit the page on Atmosphere Changes.
History of Levels of Carbon Dioxide CO2 in the Atmosphere
Because CO2 (carbon dioxide) is the principal component of greenhouse gases, CO2 plays a crucial role in the extent and rate of global warming, scientists are interested in tracking changes in the level of CO2 in the earth's atmosphere and also in the level of CO2 in the earth's oceans (where that gase moves during periods of gobal cooling).
In practical effect, even before considerations of the chemical effects of changes in CO2 in the atmosphere or oceans, this gas tracks not only global warming or cooling, but also changes in sea-level.
(See FLOOD DAMAGE CLEANUP & REPAIR GUIDE for practical information about flood damage assessment & building repairs or floodproofing). The last period of significant global warming (and atmospheric surge in CO2 occurred 120,000 years ago. [19]
In January 2013 the New York Times reported that at the dawn of the industrial revolution (ca 1760) the atmosphere typically contained 280 ppm of Carbon Dioxide (CO2) while currently (in 2013) it is common to obtain outdoor Carbon Dioxide readings close to 400 ppm. [4]
In the Pleocine epoch (about 3,000,000 years ago) CO2 levels have been estimated at about 400 ppm - a level scientists predict will be reached again (if not already by some measures) in the next few years. Relating CO2 levels and rising sea levels, scientists currently (2013) are finding beach levels ranging from 33 feet to 295 feet above current sea levels (probably before correction for shifts in actual dry land movement up or down as well). [19][20][21]
According to the Times, 450 ppm of Carbon Dioxide CO2 is considered a tipping point at which out-of-control acceleration of temperature rises occur due to the heat trapping effects of CO2 and its effect as a greenhouse gas. [4]
Levels of carbon dioxide in the earth's atmosphere have in fact ranged widely over the planet's history. A peak CO2 level [over 2000 ppm] appears to have been reached between 500 and 600 million years ago, dropping to close to current levels around 300 million years ago, and with a second surge to a much lower peak level around 100 million years ago.[8][10]
Pearson & Palmer, reporting on a study of the history of levels of carbon dioxide in the earth's atmosphere have reported:
We estimate CO2 concentrations of more than 2,000 p.p.m. for the late Palaeocene and earliest Eocene periods (from about 60 to 52 Myr ago), and find an erratic decline between 55 and 40 Myr ago that may have been caused by reduced CO2 outgassing from ocean ridges, volcanoes and metamorphic belts and increased carbon burial. Since the early Miocene (about 24 Myr ago), atmospheric CO2 concentrations appear to have remained below 500 p.p.m. and were more stable than before, although transient intervals of CO2 reduction may have occurred during periods of rapid cooling approximately 15 and 3 Myr ago.[5]
And Retallack has clearly indicated that
... For at least the past 300 Myr there is a remarkably high temporal correlation between peaks of atmospheric CO2 .... and paleotemperature maxima ... . Large and growing databases on these proxy indicators support the idea that atmospheric CO2 and temperature are coupled. [18]
Interestingly, while many scientists, including a thoughtful analysis by Mahli have pointed out that there are likely to be limits to tyhe amou7nt of casrbon storasghe possible in natural vegetaion, and that there is a significant potential to accelerate rather than brake global warming,[10][11][12][13][14][15][16][17], Kasting & Ackerman, reporting in1986 on modeling of possible effects on climate (including temperature) of high levels of carbon dioxide in the atmosphere, appeared unconvinced of the risk of development of runaway greenhouse gas conditions:
The early stratosphere should have been dry, thereby precluding the possibility of an oxygenic prebiotic atmosphere caused by photodissociation of water vapor followed by escape of hydrogen to space. Earth's present atmosphere also appears to be stable against a carbon dioxide-induced runaway greenhouse.[6]
...
Reader Comments, Questions & Answers About The Article Above
Below you will find questions and answers previously posted on this page at its page bottom reader comment box.
Reader Q&A - also see RECOMMENDED ARTICLES & FAQs
Question:
Apr 12, 2014) Anonymous said:
Is 0.9 a high level for a house
Reply:
Anon I'm not sure what scale and what gas we're talking about here. If you are asking about normal carbon dioxide CO2 gas indoors then I can't figure what your 0.9 means - normal CO2 levels are in the article above.
If by chance you are confusing carbon dioxide and the very dangerous carbon MONOXIDE or CO then it's not normal to measure any level indoors.
Question:
(Oct 30, 2014) Anonymous said:
I live in a large apartment complex in the D.C. area that was built 7 years ago. I have sampled the air inside of my apartment in various rooms many times and always observe levels of CO2 above 2000 ppm. Samples taken outside the building are below 400 ppm. Given this information I suspect that building is not adequately vented. What agency should I contact for more information.
Reply:
Anon
Have you asked your local health department for help?
Have you checked with the building owners - and advised of your concerns in writing?
Either of those steps may be useful. Keep us posted.
...
Continue reading at CARBON DIOXIDE - CO2 or select a topic from the closely-related articles below, or see the complete ARTICLE INDEX.
Or see this
Carbon Dioxide Articles
Suggested citation for this web page
TYPICAL CO2 LEVELS at InspectApedia.com - online encyclopedia of building & environmental inspection, testing, diagnosis, repair, & problem prevention advice.
Or see this
INDEX to RELATED ARTICLES: ARTICLE INDEX to GAS HAZARDS in BUILDINGS
Or use the SEARCH BOX found below to Ask a Question or Search InspectApedia
Ask a Question or Search InspectApedia
Try the search box just below, or if you prefer, post a question or comment in the Comments box below and we will respond promptly.
Search the InspectApedia website
Note: appearance of your Comment below may be delayed: if your comment contains an image, photograph, web link, or text that looks to the software as if it might be a web link, your posting will appear after it has been approved by a moderator. Apologies for the delay.
Only one image can be added per comment but you can post as many comments, and therefore images, as you like.
You will not receive a notification when a response to your question has been posted.
Please bookmark this page to make it easy for you to check back for our response.
IF above you see "Comment Form is loading comments..." then COMMENT BOX - countable.ca / bawkbox.com IS NOT WORKING.
In any case you are welcome to send an email directly to us at InspectApedia.com at editor@inspectApedia.com
We'll reply to you directly. Please help us help you by noting, in your email, the URL of the InspectApedia page where you wanted to comment.
Citations & References
In addition to any citations in the article above, a full list is available on request.
- In addition to citations & references found in this article, see the research citations given at the end of the related articles found at our suggested
CONTINUE READING or RECOMMENDED ARTICLES.
- Carson, Dunlop & Associates Ltd., 120 Carlton Street Suite 407, Toronto ON M5A 4K2. Tel: (416) 964-9415 1-800-268-7070 Email: info@carsondunlop.com. Alan Carson is a past president of ASHI, the American Society of Home Inspectors.
Thanks to Alan Carson and Bob Dunlop, for permission for InspectAPedia to use text excerpts from The HOME REFERENCE BOOK - the Encyclopedia of Homes and to use illustrations from The ILLUSTRATED HOME .
Carson Dunlop Associates provides extensive home inspection education and report writing material. In gratitude we provide links to tsome Carson Dunlop Associates products and services.
 | HOME | ABOUT | ASK a QUESTION | CONTACT | CONTENT USE POLICY | DESCRIPTION | POLICIES | PRIVACY | |
| © 2025 - 1985 Publisher InspectApedia.com - Daniel Friedman | |||||||||